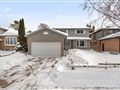
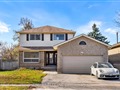
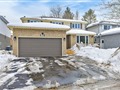
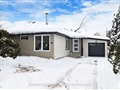
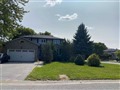
9 Havenwood Tr
$1,051,366
Comparative Market Analysis
Jun 29, 2025
NOT AN ACTIVE LISTING
Historical Performance
| Period | $ Change | % Change |
| 1 Day | +$327 | +0.031% |
| 7 Days | +$331 | +0.032% |
| 30 Days | -$1,459 | -0.139% |
| 3 Months | -$2,278 | -0.216% |
| 6 Months | +$18.5k | +1.79% |
| 1 Year | -$45.2k | -4.12% |
| 3 Years | +$195k | +22.7% |
| 5 Years | +$340k | +47.7% |
| 10 Years | +$642k | +157% |
List My Property
Real Estate Statistics
Financing Solutions
AS SEEN ON


Are You a Licensed Real Estate Agent or Broker?