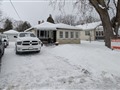
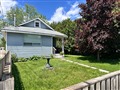
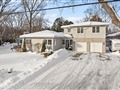
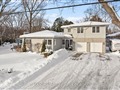
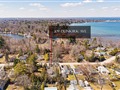
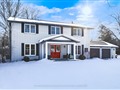
52 Garrett Dr
$1,047,365
Comparative Market Analysis
Jun 28, 2025
NOT AN ACTIVE LISTING
Historical Performance
| Period | $ Change | % Change |
| 1 Day | +$333 | +0.032% |
| 7 Days | +$293 | +0.028% |
| 30 Days | -$1,713 | -0.163% |
| 3 Months | -$3,267 | -0.311% |
| 6 Months | +$16.2k | +1.57% |
| 1 Year | -$50.3k | -4.58% |
| 3 Years | +$185k | +21.4% |
| 5 Years | +$312k | +42.4% |
| 10 Years | +$611k | +140% |
List My Property
Real Estate Statistics
Financing Solutions
AS SEEN ON


Are You a Licensed Real Estate Agent or Broker?