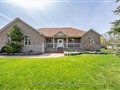
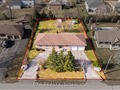
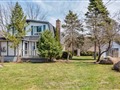
49 Ferncroft Dr
$1,565,494
Comparative Market Analysis
May 4, 2024
NOT AN ACTIVE LISTING
Historical Performance
| Period | $ Change | % Change |
| 1 Day | +$477 | +0.031% |
| 7 Days | +$274 | +0.017% |
| 30 Days | -$3,161 | -0.202% |
| 3 Months | -$6,462 | -0.411% |
| 6 Months | +$21.3k | +1.38% |
| 1 Year | -$82.1k | -4.98% |
| 3 Years | +$238k | +17.9% |
| 5 Years | +$424k | +37.1% |
| 10 Years | +$884k | +130% |
List My Property
Real Estate Statistics
Financing Solutions
AS SEEN ON


Are You a Licensed Real Estate Agent or Broker?