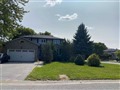
3 Havenwood Tr
$1,080,132
Comparative Market Analysis
Jun 29, 2025
NOT AN ACTIVE LISTING
Historical Performance
| Period | $ Change | % Change |
| 1 Day | +$336 | +0.031% |
| 7 Days | +$322 | +0.030% |
| 30 Days | -$1,591 | -0.147% |
| 3 Months | -$2,640 | -0.244% |
| 6 Months | +$18.4k | +1.73% |
| 1 Year | -$47.8k | -4.24% |
| 3 Years | +$195k | +22.1% |
| 5 Years | +$341k | +46.1% |
| 10 Years | +$649k | +151% |
List My Property
Real Estate Statistics
Financing Solutions
AS SEEN ON


Are You a Licensed Real Estate Agent or Broker?