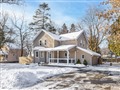
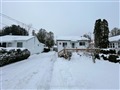
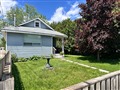
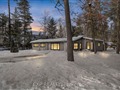
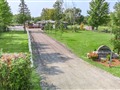
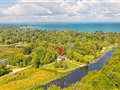
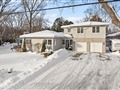
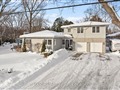
28 Garrett Dr
$888,474
Comparative Market Analysis
Jun 28, 2025
NOT AN ACTIVE LISTING
Historical Performance
| Period | $ Change | % Change |
| 1 Day | +$283 | +0.032% |
| 7 Days | +$245 | +0.028% |
| 30 Days | -$1,471 | -0.165% |
| 3 Months | -$2,826 | -0.317% |
| 6 Months | +$13.6k | +1.56% |
| 1 Year | -$42.9k | -4.60% |
| 3 Years | +$156k | +21.3% |
| 5 Years | +$264k | +42.3% |
| 10 Years | +$517k | +139% |
List My Property
Real Estate Statistics
Financing Solutions
Browsing History
194 Beach Rd, Georgina
6 seconds ago
239 Boyers Rd, Georgina
11 seconds ago
34 Wexford Dr, Georgina
16 seconds ago
26781 Woodbine Ave, Georgina
20 seconds ago
AS SEEN ON


Are You a Licensed Real Estate Agent or Broker?