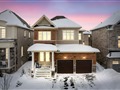
27 Waterbend Dr
$1,257,372
Comparative Market Analysis
Jun 27, 2025
NOT AN ACTIVE LISTING
Historical Performance
| Period | $ Change | % Change |
| 1 Day | +$391 | +0.031% |
| 7 Days | +$710 | +0.057% |
| 30 Days | -$109 | -0.009% |
| 3 Months | +$3,434 | +0.274% |
| 6 Months | +$37.4k | +3.06% |
| 1 Year | -$10.0k | -0.791% |
| 3 Years | +$292k | +30.3% |
| 5 Years | +$382k | +43.6% |
| 10 Years | +$676k | +116% |
List My Property
Real Estate Statistics
Financing Solutions
Browsing History
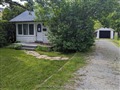
186 Bayview Ave, Georgina
5 seconds ago
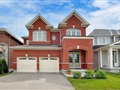
26 Camrose Dr, Georgina
10 seconds ago
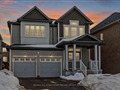
97 Riveredge Dr, Georgina
15 seconds ago
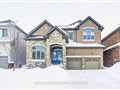
26 Waterbend Dr, Georgina
20 seconds ago
AS SEEN ON


Are You a Licensed Real Estate Agent or Broker?