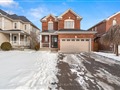
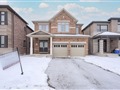
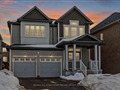
26 Waterbend Dr
$977,786
Comparative Market Analysis
Jun 27, 2025
NOT AN ACTIVE LISTING
Historical Performance
| Period | $ Change | % Change |
| 1 Day | +$304 | +0.031% |
| 7 Days | +$474 | +0.048% |
| 30 Days | -$524 | -0.054% |
| 3 Months | +$767 | +0.079% |
| 6 Months | +$23.7k | +2.49% |
| 1 Year | -$24.7k | -2.46% |
| 3 Years | +$243k | +33.2% |
| 5 Years | +$378k | +63.0% |
| 10 Years | +$641k | +190% |
List My Property
Real Estate Statistics
Financing Solutions
AS SEEN ON


Are You a Licensed Real Estate Agent or Broker?