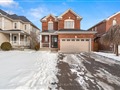
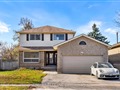
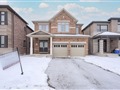
22 Waterbend Dr
$1,152,841
Comparative Market Analysis
Jun 28, 2025
NOT AN ACTIVE LISTING
Historical Performance
| Period | $ Change | % Change |
| 1 Day | +$358 | +0.031% |
| 7 Days | +$398 | +0.035% |
| 30 Days | -$1,428 | -0.124% |
| 3 Months | -$1,939 | -0.168% |
| 6 Months | +$21.4k | +1.90% |
| 1 Year | -$46.8k | -3.90% |
| 3 Years | +$223k | +23.9% |
| 5 Years | +$388k | +50.8% |
| 10 Years | +$721k | +167% |
List My Property
Real Estate Statistics
Financing Solutions
Browsing History
28 Bamburg St, Georgina
6 seconds ago
56 Hattie Crt, Georgina
11 seconds ago
36 Wrendale Cres, Georgina
16 seconds ago
135 Parkview Rd, Georgina
21 seconds ago
804 Poplar Ave, Georgina
26 seconds ago
32 Ivygreen Rd, Georgina
31 seconds ago
3 Rushton Rd, Georgina
35 seconds ago
AS SEEN ON


Are You a Licensed Real Estate Agent or Broker?