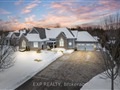
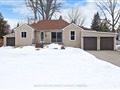
11 Farley Circ
$539,468
Comparative Market Analysis
Jun 27, 2025
NOT AN ACTIVE LISTING
Historical Performance
| Period | $ Change | % Change |
| 1 Day | +$165 | +0.031% |
| 7 Days | +$960 | +0.178% |
| 30 Days | +$3,942 | +0.736% |
| 3 Months | +$20.7k | +3.98% |
| 6 Months | +$60.4k | +12.6% |
| 1 Year | +$38.6k | +7.72% |
| 3 Years | +$135k | +33.4% |
| 5 Years | +$190k | +54.4% |
| 10 Years | +$326k | +153% |
List My Property
Real Estate Statistics
Financing Solutions
Browsing History
45 Ferncroft Dr, Georgina
6 seconds ago
Ailsa Dr, Georgina
11 seconds ago
84 Wyndham Circ, Georgina
16 seconds ago
36 Glendower Cres, Georgina
20 seconds ago
AS SEEN ON


Are You a Licensed Real Estate Agent or Broker?