($title)
($content)
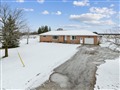
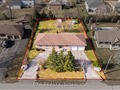
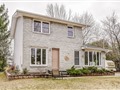
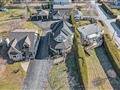
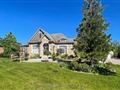
43 Farley Circ
$1,010,304
Comparative Market Analysis
Apr 25, 2024
NOT AN ACTIVE LISTING
Historical Performance
| Period | $ Change | % Change |
| 1 Day | +$308 | +0.031% |
| 7 Days | +$177 | +0.017% |
| 30 Days | -$2,040 | -0.202% |
| 3 Months | -$4,170 | -0.411% |
| 6 Months | +$13.7k | +1.38% |
| 1 Year | +$382k | +60.7% |
| 3 Years | +$543k | +116% |
| 5 Years | +$632k | +167% |
| 10 Years | +$782k | +343% |
List My Property
Request Sold History
Real Estate Statistics
Financing Solutions
AS SEEN ON

FOR SALE
FOR RENT
LIST PROPERTY FOR SALE
Property Type
Barrie 637
Brampton 1.23k
Burlington 408
Georgina 249
Pefferlaw 29
see all
Hamilton 1.24k
Kawartha Lakes 505
London 432
Markham 606
Mississauga 1.40k
Niagara Falls 326
Oakville 657
Oshawa 406
Richmond Hill 667
Toronto 7.31k
Vaughan 863
Bedrooms
Bathrooms
Search Listings
Save Graph
How is this Graph Generated?
GRAPH AND COMPARATIVE MARKET ANALYSIS (CMA) METHODOLOGY
The CMA graph for 43 Farley Circ is based on Georgina 365-day running median for 2+1-bedroom, 2-bathroom
detached house properties and adjusted for sold comparables in the area. This CMA does not reflect recent home improvements that may have been done to this property.
The CMA represents a seasonally adjusted long term valuation trends and may not immediately reflect short term market fluctuations. If you are interested in raw
monthly real estate market statistics and short term market fluctuations, please refer to
real estate statistics for Georgina.
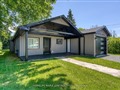
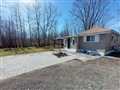
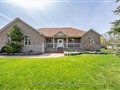
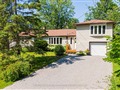
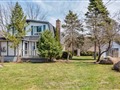
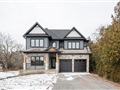
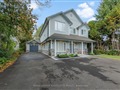
SIMILAR PROPERTIES FOR SALE

Unlock Endless Possibilities With This Amazing 3.4 Acre Property Which Includes Two Residential Homes And An Industrial Building. The Main House Is A...
Welcome to your ultimate family retreat! This solid Ranch-style bungalow sits proudly on an expansive 176ft x 179ft lot, offering endless...
Welcome to your lakeside neighborhood! Just minutes away from the tranquil shores of Lake Simcoe, this charming 2-bedroom bungalow offers the perfect...
Look no further! This move-in ready raised bungalow has all the elegance and charm in 1600 sq ft. 3 generous size bedrooms, 2 bathrooms. Many...
Spacious Raised Brick Bungalow On A Massive 100x150 Double Lot In Willow Beach Area With Sandy Beach And Park Down The Street. Circular Driveway With...
Wonderful three bedroom, two bathroom family home situated on a large lot, just steps from Lake Simcoe! Spacious bright and inviting main floor...
Amazing Opportunity! Don't Miss Out Beautiful Spacious, Completely Renovated 3 Bdrm, 2 Bath Bungalow Open Concept Living Dining/Kitchen W.Vaulted...
this is a recently renovated and ready to move in 3 bedrooms bungalow. This home has a large 50X167 feet lot, and is at the end of a cul-de-sac...
Welcome To 44 Shore Cres. Make This Your Full Time Residence Or Your Go To Weekend Getaway.Your Opportunity To Live Minutes To Lake Simcoe,Historic...
In the quiet enclave of Willow Beach, an exceptionally upgraded and renovated property that promises to captivate the senses. A picturesque haven...
Rare Find Gem On Established 110' X 140' Premium Lot, Steps To Lake Simcoe. Fully Renovated and Bright, Newly Finished Studio Apartment Above Garage...
This Family Size 4 Bedroom Home Is Located In A Prime Area Of Fine Lakefront Residences On A Quiet Crescent Just Steps To Lake Simcoe. Situated On A...
This magnificent custom built executive home sits on a 50' x 242' lot in the prestigious lakeside Willow Beach neighbourhood. High end custom...
Discover paradise in this exclusive enclave of executive homes. Embrace an idyllic lifestyle on this enchanting 1-acre property, perfectly positioned...
Introducing Willow Beaches Finest Custom Built Home with Private Beach Access Nestled Amidst The Serene Beauty of Nature, This Exquisite Home Has...
2+1
BEDROOMS
2
BATHROOMS
1
KITCHENS
ADDRESS
PROPERTY TYPE
Detached House
LOT SIZE50.00 x 117.00
STATUSNOT AN ACTIVE LISTING
COMPARATIVE MARKET ANALYSIS
$1,010,304
Refinance Your Property
Comparative Market Analysis of 43 Farley Circ is based on market trends for Historic Lakeshore Communities community of Georgina community and recent sales in the area.
The sold statistics information is provided by Toronto Real Estate Board (Reference: Competition Bureau vs. TREB in Federal Court of Appeal - 27 April, 2016;
TREB's appeal was dismissed and it is now mandated to provide sold data to the public).
Comparative Market Analysis is provided for reference purposes only and may be
different from the actual market sold price or an appraised value. Comparative Market Analysis does not take into account recent home improvements that have been
carried out to the property. Listing.ca does not bare any responsibility to the accuracy of the provided opinion. The graph represents a seasonally
adjusted long term valuation trends and may not immediately reflect short term market fluctuations.
SALES HISTORY
SOLD COMPARABLES
MARKET STATS
XX/XX/20XX
SOLD
$XXX,000
XX/XX/20XX
SOLD
$XXX,000
XX/XX/20XX
SOLD
$XXX,000
XX/XX/20XX
SOLD
$XXX,000
XX/XX/20XX
SOLD
$XXX,000
XX/XX/20XX
SOLD
$XXX,000
Request Sold History
2+1 Beds
2 Baths
Sold Price
$685,000
List Price
$699,900
Sold Date
11/13/2023
DOM
XX Days
2+1 Beds
2 Baths
Sold Price
$1,050,000
List Price
$1,125,000
Sold Date
08/10/2023
DOM
XX Days
2+1 Beds
2 Baths
Sold Price
$900,000
List Price
$919,000
Sold Date
07/07/2023
DOM
XX Days
2 Beds
1 Baths
Sold Price
$615,000
List Price
$624,900
Sold Date
11/24/2023
DOM
XX Days
2+1 Beds
2 Baths
Sold Price
$1,485,000
List Price
$1,499,500
Sold Date
06/04/2023
DOM
XX Days
Request All 63 Sold Comparables
PROPERTY DESCRIPTION
43 Farley Circ is a 2+1-bedroom 2-washroom detached house located in Historic Lakeshore Communities community of Georgina. It is currently NOT FOR SALE, but is
worth in our opinion around $1,010,304
.
The property is situated on a 50' frontage by 117' deep lot. 43 Farley Circ is currently not for sale and is not an active listing on Listing.ca.
NEARBY GROCERY STORES
The property is situated on a 50' frontage by 117' deep lot. 43 Farley Circ is currently not for sale and is not an active listing on Listing.ca.
Foodland 30.5 km
35 Cameron E, L0E1E0
Phone: (705) 432-3398 Foodland 21.2 km
52 Queen St, L0L1L0
Phone: (705) 458-1611 FreshCo 11.5 km
443, The Queensway S, L4P2C9
Phone: (905) 476-7773 No Frills 7.2 km
20895 Dalton Rd, L0E1R0
Phone: (905) 686-1440 Sobeys 7.2 km
20954 Dalton Rd, L0E1R0
Phone: (905) 722-5671 Zehrs Markets 4.6 km
24018 Woodbine Ave, L4P3E9
Phone: (905) 476-1318
NEARBY LIQUOR STORES
35 Cameron E, L0E1E0
Phone: (705) 432-3398 Foodland 21.2 km
52 Queen St, L0L1L0
Phone: (705) 458-1611 FreshCo 11.5 km
443, The Queensway S, L4P2C9
Phone: (905) 476-7773 No Frills 7.2 km
20895 Dalton Rd, L0E1R0
Phone: (905) 686-1440 Sobeys 7.2 km
20954 Dalton Rd, L0E1R0
Phone: (905) 722-5671 Zehrs Markets 4.6 km
24018 Woodbine Ave, L4P3E9
Phone: (905) 476-1318
The Wine Shop 4.6 km
24018 Woodbine Ave, L4P3E9
Phone: (905) 476-8544
24018 Woodbine Ave, L4P3E9
Phone: (905) 476-8544
Are You a Licensed Real Estate Agent or Broker?
© 2011-2024 Real Estate Bay Realty Inc, Brokerage
The information provided herein must only be used by consumers that have a bona fide interest in the purchase, sale, or lease of real estate and may not be used for any commercial or any other purpose. Information is deemed reliable but is not guaranteed accurate by TREB, Listing.ca or Real Estate Bay Realty, Brokerage.
The trademarks MLS®, Multiple Listing Service® and the associated logos are owned by The Canadian Real Estate Association (CREA) and identify the quality of services provided by real estate professionals who are members of CREA. Used under license.
Real Estate Bay Realty, Brokerage
220 Duncan Mill Road, Suite 209
Toronto, ON M3B 3J5
Phone: 416-800-1055
info@listing.ca Listing.ca on Twitter
RealEstateBay.ca on Facebook
220 Duncan Mill Road, Suite 209
Toronto, ON M3B 3J5
Phone: 416-800-1055
info@listing.ca Listing.ca on Twitter
RealEstateBay.ca on Facebook